This past week was SGDQ 2017, the latest GamesDoneQuick charity speed-run marathon. For the past year, I’ve been managing an unofficial stats page for these events called GDQStat.us. This is the third event that I’ve hosted this site, and a lot has changed in this iteration.
In particular, I rewrote the entire front-end in React + Redux (all within 1 week of the start of the event… 😅 ) and made various improvements to my AWS backend to increase the volume and value of the data I collected.
Front End Improvements
The most visible change of SGDQ 2017’s version of GDQStatus is the front end. Pretty much everything except the theming of the site changed. I still use Jekyll as a templating engine for the HTML frames of the site, but React is used for all of the visualization rendering, dataflow, and page logic.
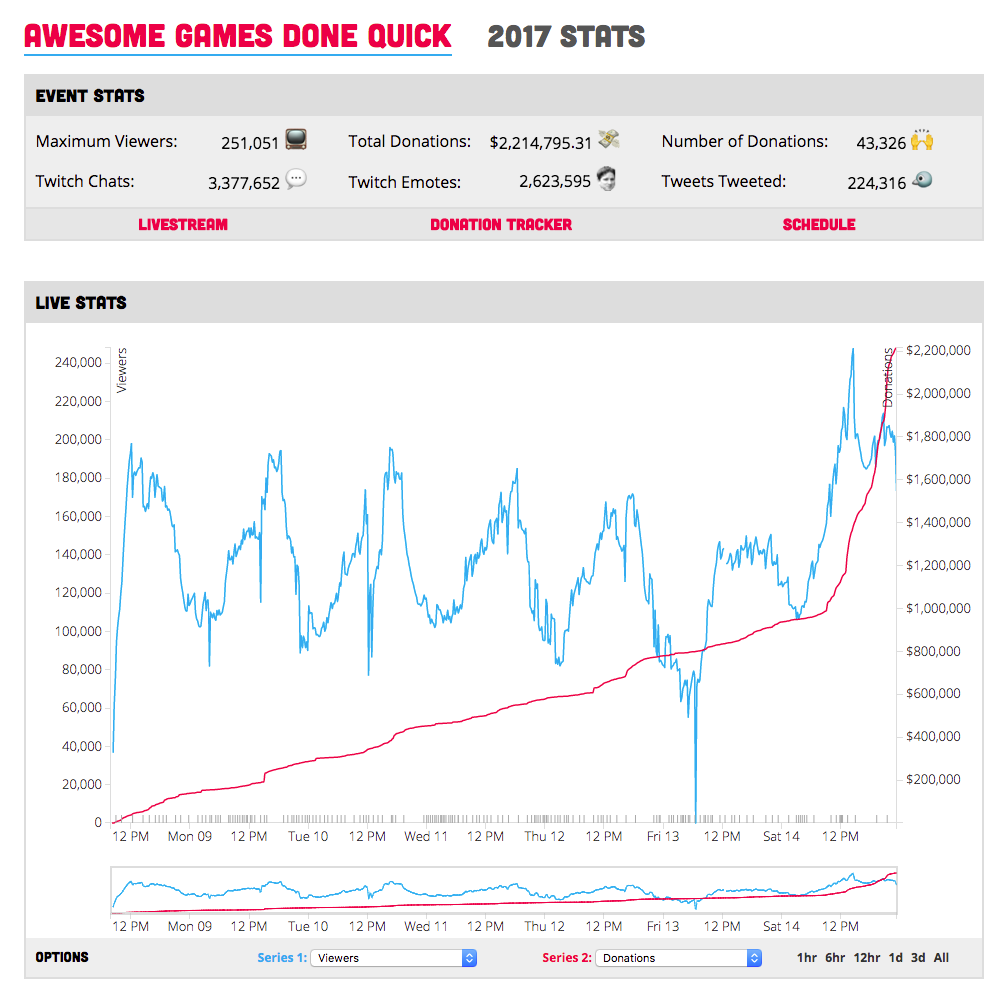
AGDQ 2017 (Before Rewrite)
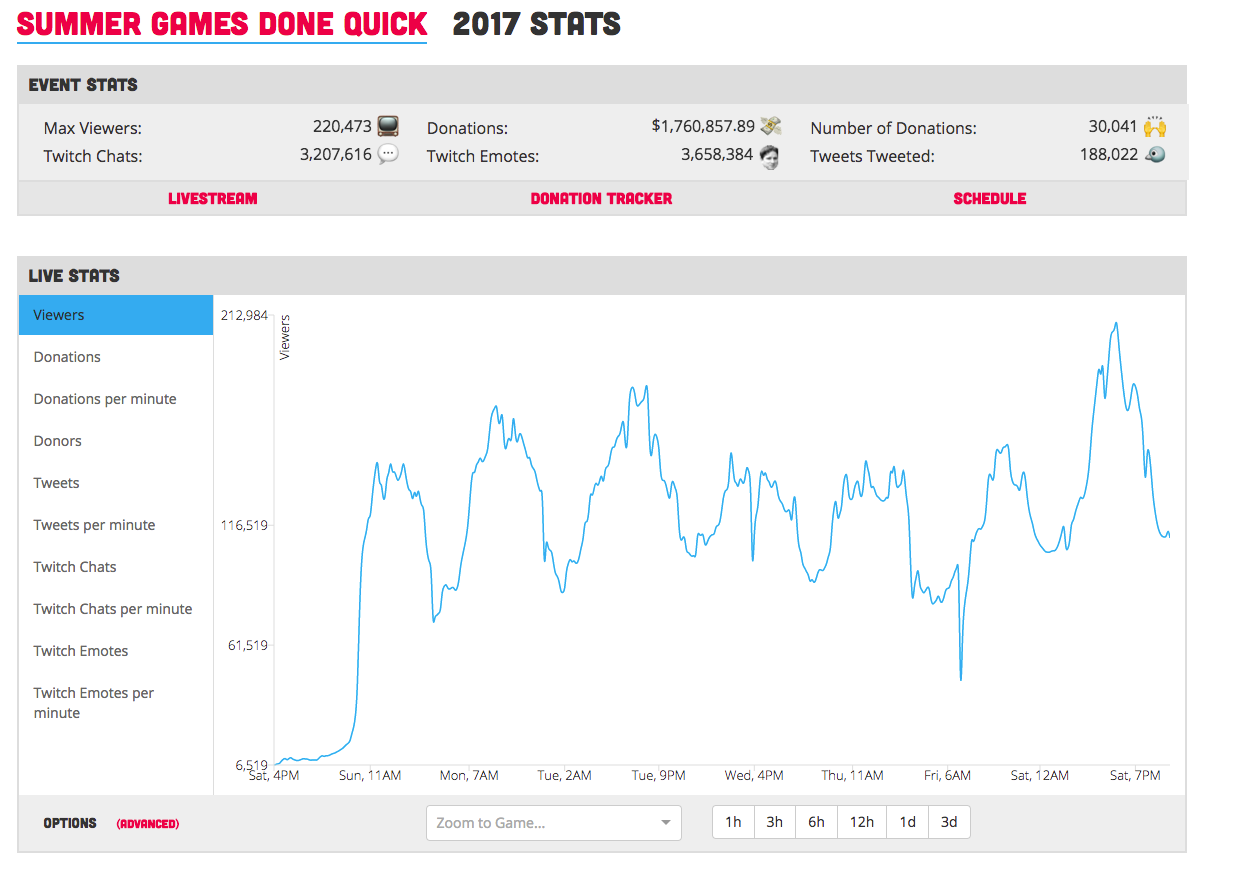
SGDQ 2017 (After Rewrite)
For reference, here is the AGDQ 2017 frontend code base1, and here is the SGDQ 2017 codebase.
React Rewrite
The initial version of GDQStatus was my first ‘big’ web app development project. As such, it was built on a variety of anti-patterns that became untenable to maintain over time.
My D3 visualizations were highly performant (I spent a lot of time optimizing the Javascript), but they were deeply coupled to the structure of my data. Thus, changing any portion of how the backend served timeseries data caused a huge headache when updating the front end.
Additionally, I had to do a lot of hacks when it came to pulling down data from the server. I used a global Singleton object to manage pulling data from the server, with an event listener callback style method of updating components. This method worked, but occasionally lead to weird behavior and became untenable when I switched to Webpack due to the way that modules are imported (it’s difficult to get a truly global object without even more hacks).
I’ve been working on a bunch of React projects, and so I bit the bullet and rewrote the entire site in React. This took surprisingly little time. I was able to get a feature-parity version of the old site in only a couple days.
Now, Redux manages pulling server from the data. Each component on the page can be connected to a copy of that data. Page components are declarative, I don’t have to worry about writing component update code, and the dataflow is now clean and explicit.
Switching to Recharts
Unfortunately, React and D3 don’t play well together. There are a couple of projects2, and a variety of blog posts that tell you how it’s possible to get React and D3 to function properly, but you lose a lot of the niceties of both React and D3 in the process.
I wasn’t super happy with how spaghettified my D3 visualization code had become (~600 lines of terse Javascript), so I felt alright ditching it all and doing a rewrite.
I tried the whole gamut of React charting libraries (Victory, React-Vis, ReactD3, React-c3js, etc) before finally settling on Recharts. Recharts has a declarative API, and a pretty powerful set of components that got me 90% of the way to my previous custom D3 code.
I still had to do a decent amount of customization to get Recharts to look and behave the way I wanted, but that entire ~600 lines of terse D3 Javascript roughly compressed down to this, using Recharts:
<ResponsiveContainer width='100%' height={500}>
  <LineChart data={resampleSeries} margin={{top: 20}}>
    {this.getGraphSeries({activeGraph, isPrimary: true})}
    <Tooltip
      content={<GamesTooltip
        schedule={this.props.schedule}
        format={tooltipFormat}
        secondaryFormat={tooltipFormatSecondary} />}
      animationDuration={250} />
    <XAxis
      dataKey='time'
      type='number'
      scale='time'
      axisLine={!{stroke: '#ddd'}}
      tickLine={{stroke: '#ddd'}}
      tickFormatter={dateFormat}
      tick={{fill: '#333', fontWeight: 300, fontSize: 13}}
      interval='preserveStart'
      domain={['dataMin', 'dataMax']}
      minTickGap={50} />
  </LineChart>
</ResponsiveContainer>
Declarative Charts are Awesome!
Recharts is not perfect, though. It’s documentation is kinda spotty (I plan to make some contributions to improve clarity), and it can be a bit buggy.
Improved Discoverability
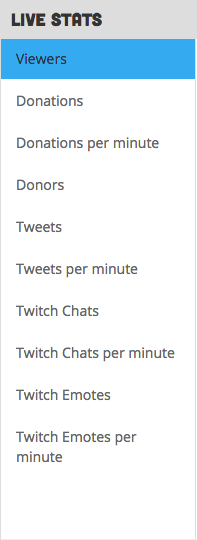
The UI ‘breakthrough’ that I’m most proud of with this version of the site is the chart series sidebar.
With previous versions of the site, the UI was a bit muddled: you’d almost always have 2 line series on the screen at one time, and the graph options were hidden away in a select element.

With the new version of the graphs, it’s clearly visible the moment you see the graph exactly what you’re looking at, and all the options that you have in picking data series.
I don’t have any analytics on how users interacted with this new UI, but from anecdotes, the reception was quite positive.
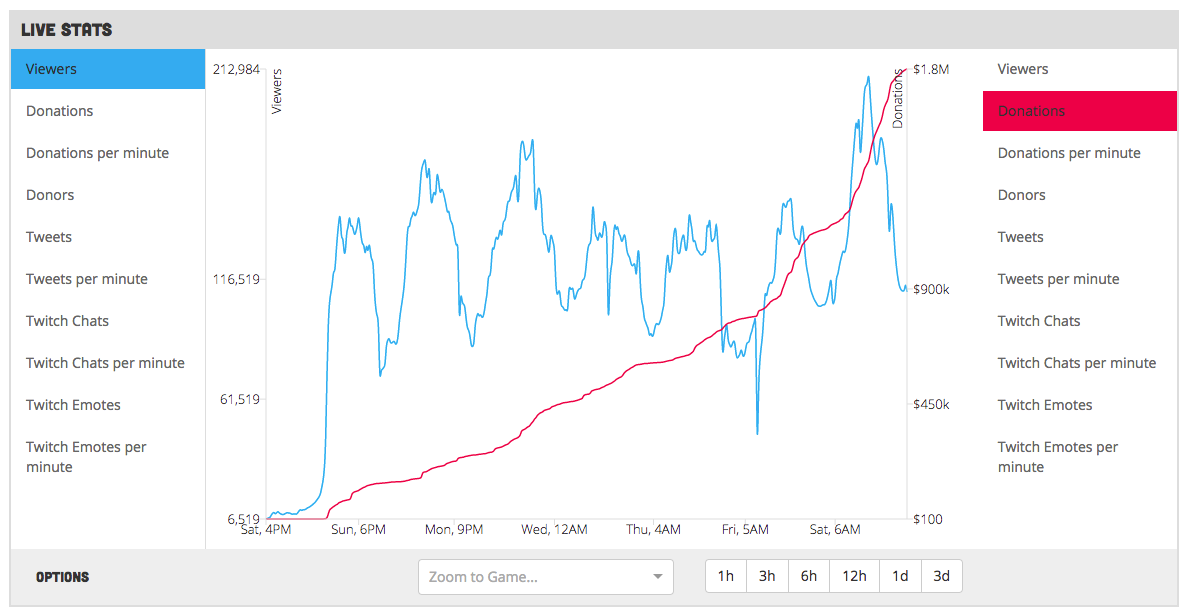
Unfortunately, this new UI didn’t include the “double graph” option for simplicities sake. So, I made an “Advanced” graph page so that this option was still available:
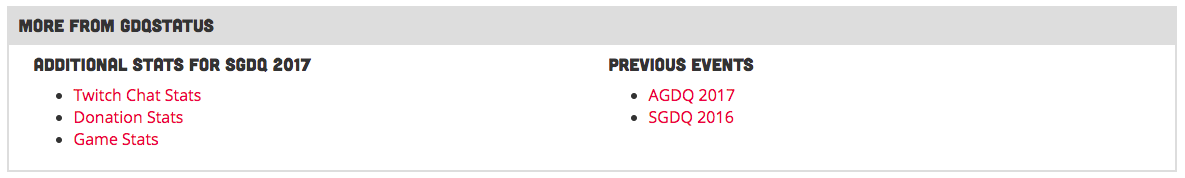
Also, in the vein of improving discoverability, I finally started linking to previous versions of the site on the home page. I’ve always made previous versions of the site available, but they weren’t easily discoverable. I noticed that after I added this, many more people started to view pages from previous GDQ events.
Jekyll Painpoints
As mentioned previously, I’m still using Jekyll as the templating and site creation engine for GDQStatus. Jekyll is a pretty solid static-site generation tool, but I discovered a subtle bug. If you change JEKYLL_ENV between builds, but not the source of the HTML pages, Jekyll doesn’t rebuild them by default. This led to me deploying versions of the site that didn’t include my Google Analytics code (I don’t render the analytics code on development versions of the site).
This wasn’t a huge issue (other than a few-hour blind spot in analytics), but it was frustrating nonetheless. It’s not a good feeling when you realize that there’s a problem in your build pipeline.
I fixed this issue by cleaning the Jekyll build folder before doing production builds, to ensure that everything is built from scratch correctly.
Development at Breakneck Speed!
Over the course of the week, I added 4 new pages to the site:
- The “Advanced” Graph page
- A Twitch Chat Stats page
- A GDQ Donations Stats page
- A Games State page (which ranked games by viewership and donations raised)
I’m especially proud of the donations page. It features a good assortment of data visualization styles (Statistics Odometers, Pie Charts, and Horizontal Bar Charts), and was probably the most time consuming additional page – for reasons I won’t get in to, I had to use C3js for the Pie Charts, which took a bit of retooling.
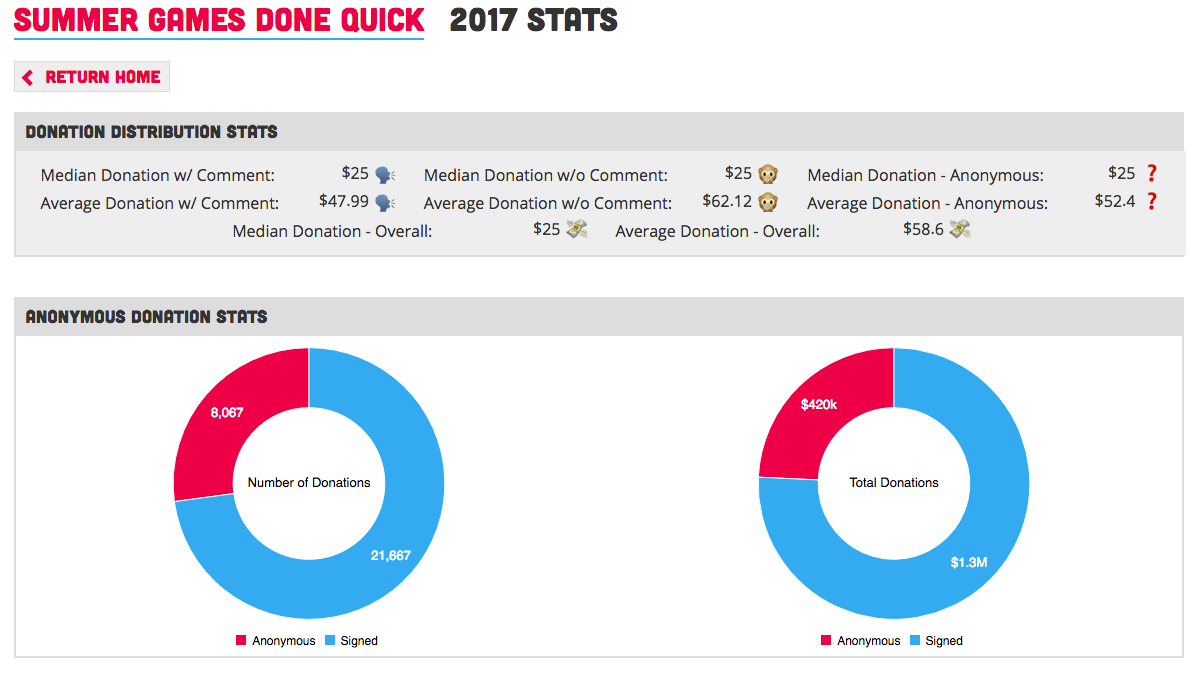
Excerpt from Donations Stats Page
All of these pages were made possible by writing composable, reusable graph components in React with Recharts. I created a powerful template in writing the home page that allowed me to do a lot of code-reuse to spin out these new stats pages very quickly.
That being said, I did pour a lot of dev hours into the front-end during the week – I certainly spent more time on the front-end improvements than on the back-end.
Back End Improvements
There were many fewer architectural changes on the back-end of the project. For AGDQ 2017, I rewrote the backend to work on AWS (I had been using Firebase and GCP before this).
However, I did make some interesting changes for this event:
Collecting More Data
I decided to store much more granular data about the event this year. I stored every Tweet and Twitch Chat that I scraped, and also scraped donation comments from the GDQ donation tracker.
Disclaimer: It’s worth noting here that I actively try to be as respectful as possible to the GDQ infrastructure. The GDQ donation tracker gets a lot of traffic during the event, and the last thing I want to do is cause any negative impact to it’s performance. I am very careful to rate limit all of my scraping code so as to avoid putting load on their system.
In previous events, I didn’t save this data because I didn’t know what to do with it. This year, I thought it’d be worth doing anyways, just as an interesting dataset.
During the course of the week, the Chat Stats page was powered by the Twitch Chat data, and the Donations page was powered by the scraped donation data.
I was a bit concerned about the storage implications of this, but the entire dataset ended up being a trivial ~250MB, so these concerns were unwarranted. – Even though Twitch chat generated ~3.2 million messages, most of them are relatively tiny.
Restructuring the Lambda Suite
I restructured the way my lambda expressions were deployed as well. Previously, I had 2 separate Zappa ‘projects’. One for the API and caching, and another for monitoring.
I combined these two projects into one, and broke them up into separate ‘stages’. This allowed me to share resources (like utilities and credentials) amongst the projects, while still deploying smaller, focussed lambdas.
I had 3 Lambda stages after the restructure:
- Recent Timeseries API
- Database Caching
- Monitoring
This allowed me to track metrics for the API separate from the caching layer, which gave me much clearer visibility into how the site was performing.
I think this way of structuring Lambda projects works fairly well. It keeps code together, while still allowing a separation of concerns in AWS.
The Value of a Good Dashboard
This GDQ, I also spent a lot more time on my dashboard. I came up with a layout that I’m very happy with:

This clearly tells me how my EC2 instance is doing, how my lambda functions are doing, and the general traffic the site is getting.
From this dashboard I discovered a couple things:
- I was observing way more Lambda activations than I should be getting for the amount of traffic I was serving.
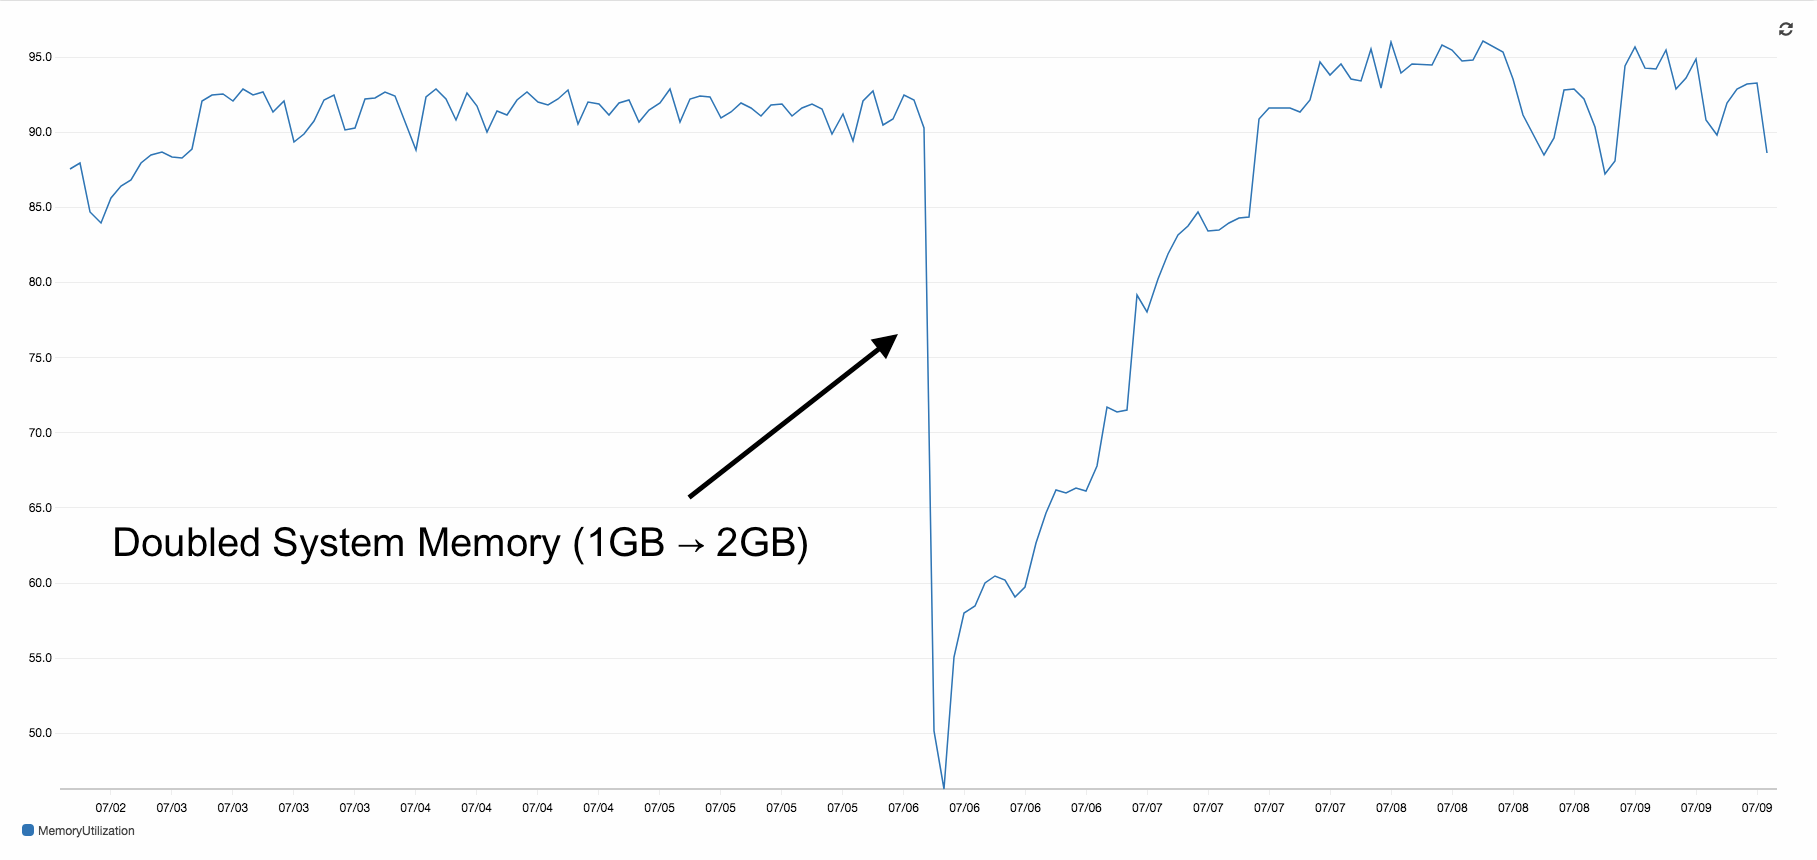
- My EC2 instances memory was getting hammered.
The first issue was, I think, caused by users not closing the GDQStatus window, and leaving it running in the background. The page kept updating every minute regardless of if it was active in the browser or not. I used VisibilityJS to only update the page when it was active, and saw my Lambda activations fall to a more appropriate level.
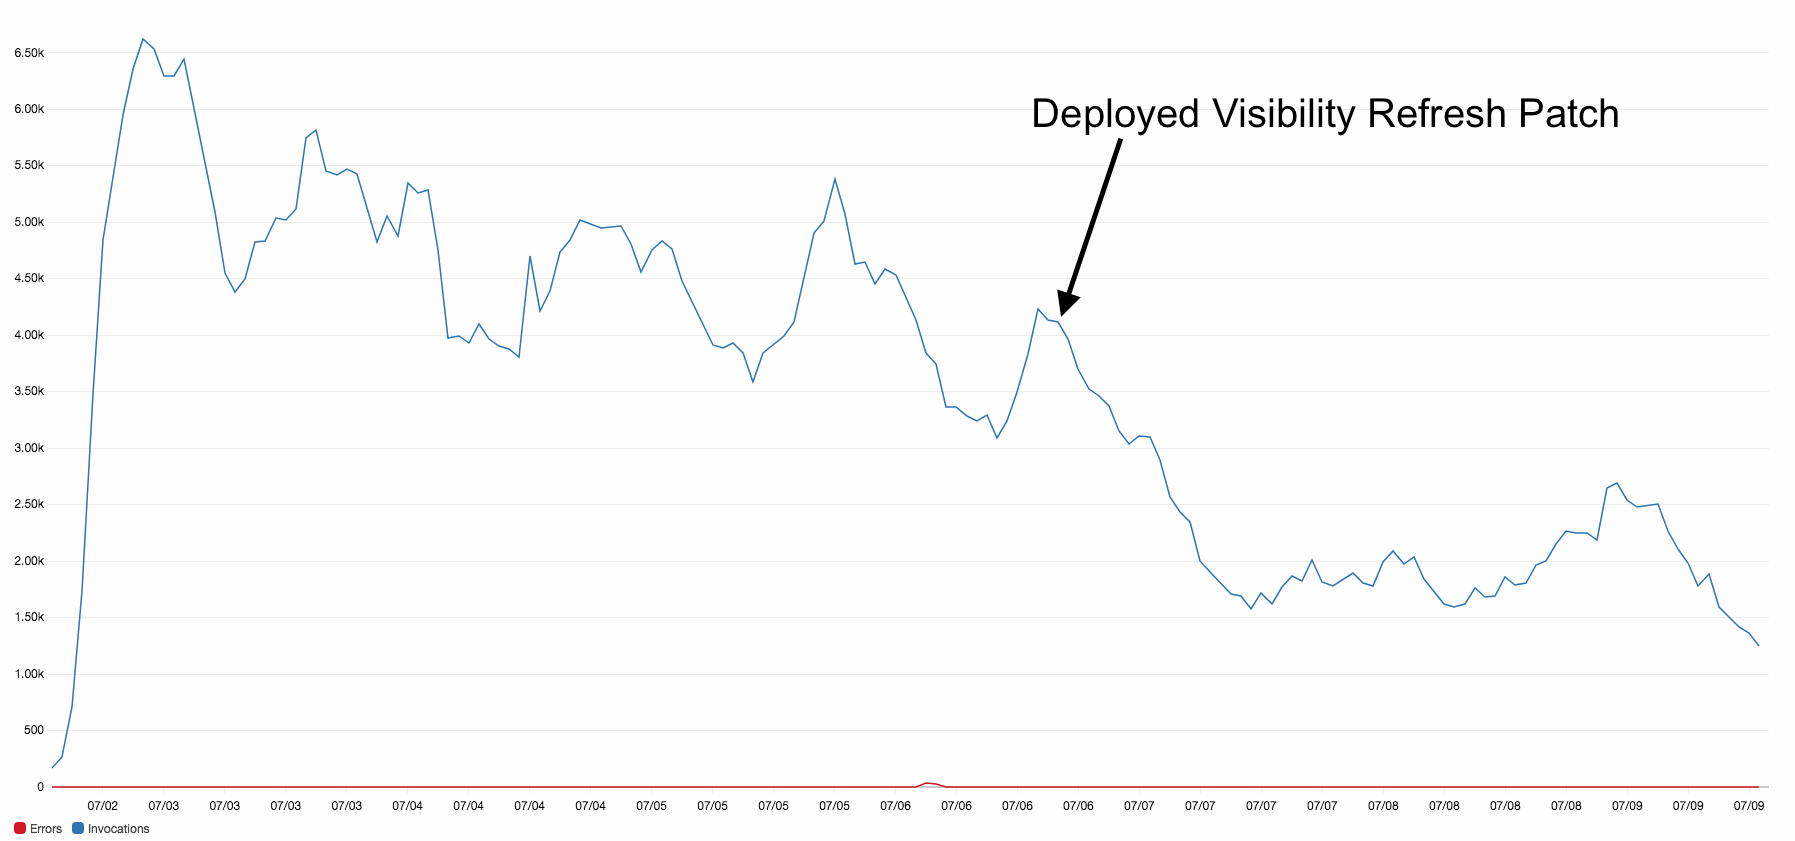
(It’s worth noting when reading that graph that I was receiving an increasing amount of traffic throughout the whole week, so that dip occurred in activations even as traffic increased)
As far as the memory issue, I’m still somewhat stumped. I’m pretty sure that the memory was being consumed by Python – specifically APScheduler. I doubled my system memory to try to “throw more hardware at the problem”, but the issue persisted. This warrants additional investigation.
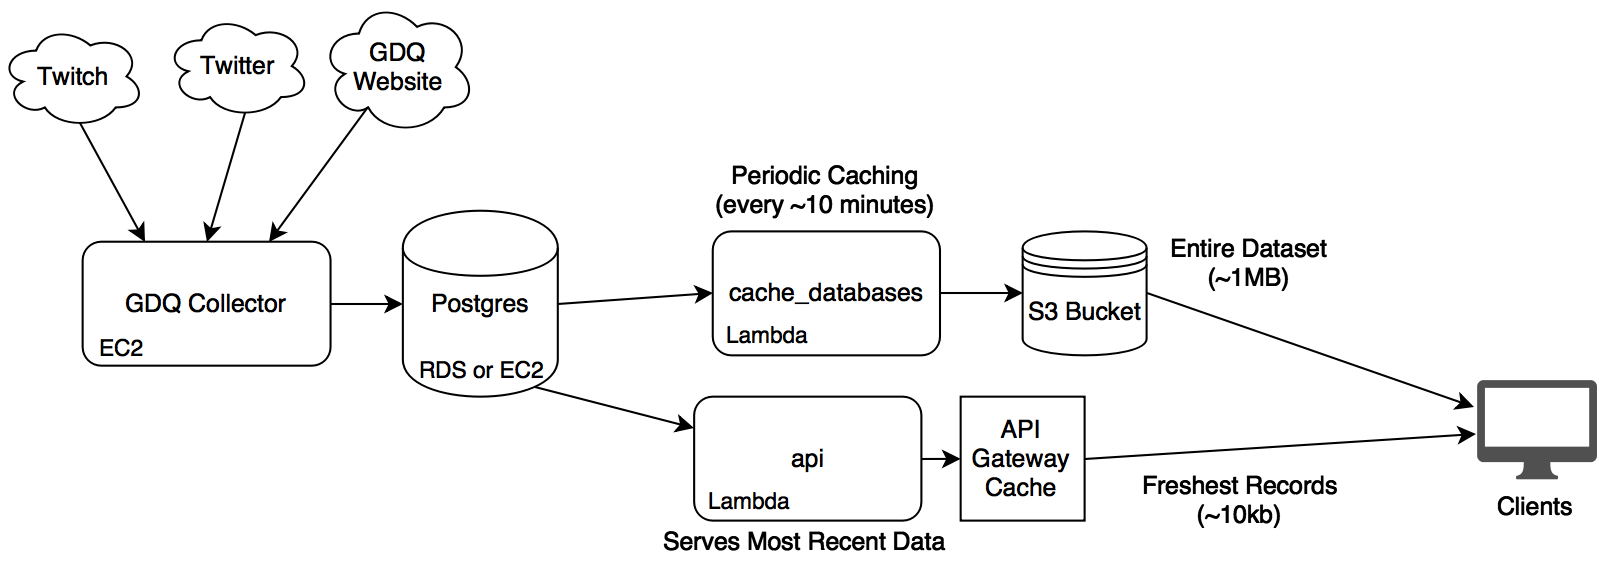
On an unrelated note, I added a cool infrastructure layout image to the GDQ-Collector repo, which I’m fairly happy with:
Analytics
As far as traffic and analytics are concerned, this version of GDQStatus was a huge success. It was by far the most successful version of the site in terms of site traffic.
Traffic for GDQStatus tends to be “spiky”, so this year I was pleasantly surprised to see that the “base” amount of traffic between spikes was a lot higher than in the past.
From analytics, it looks like more people are coming to the site directly than in the past, suggesting that more people know about the site. (Anecdotes back this up as well)
Of course, none of this project is about pageviews (I don’t run ads, I don’t get anything out of this traffic other than internet points 😛 ), but it’s really rewarding to see that people tended to react quite positively towards GDQStatus – and it was cool to see the analytics bear that out.
Conclusion
As usual, everything about this project is open source. Here is the repo for the GDQStatus front-end, and here is the repo for all the backend code.
Most of the data from this event and previous events is already public (look in the data folder of the front-end repo), but I decided to make my database dumps public as well, so that anyone can do deeper analysis if they want. Those database dumps can be found here. If you do something interesting with this data, definitely send me a link! (A small attribution would be nice, too. 🙂 )
So, that’s it for this GDQ. I had a blast, and I got to write some fun code, too!
(Oh, and of course, check out GDQStatus if you haven’t already!)