I’ve been working on a site for the past month that generates 3D models from Github’s contribution graphs.
After a month of work, it’s complete! So, I’m happy to announce GitTrophy. It’s pretty slick: type in a Github user or repo name, and you’ll get a 3D preview of the contribution model. I 3D printed my chart from 2016, and it turned out pretty well.
Demo of GitTrophy
Inspiration
Looking at my Github profile, it’s not hard to tell that I care about my contribution history. That’s why I’ve found previous projects like Github Report Card1, Commit Print, and Isometric Contributions so interesting.2
My initial idea was to have some type of generator to create 3d models of Github contributions. I wasn’t sure if I’d be able to hack it to work in a browser (though that was the ultimate goal), or if it’d be just a script.
The design for the models was largely inspired by Isometric Contributions, and the resulting web page was inspired heavily by Commit Print.
Initial Prototype
My initial thought was that model creation would have to be done server-side. After looking at the landscape of Python 3d modeling frameworks, I was left pretty disappointed. The only tool that seemed to fit all my requirements – scriptable modeling, output to commonly accepted file formats, ability to run headless, and ability to apply colors/textures – was Blender. Obviously, Blender is a great project. But… it was a bit heavy-weight for what I was trying to accomplish.
Model Generation
I tooled around with creating a Blender Python script (against bpy), and came up with something that could take a list of days and colors, and transform it into something that looked like the Github contributions chart.
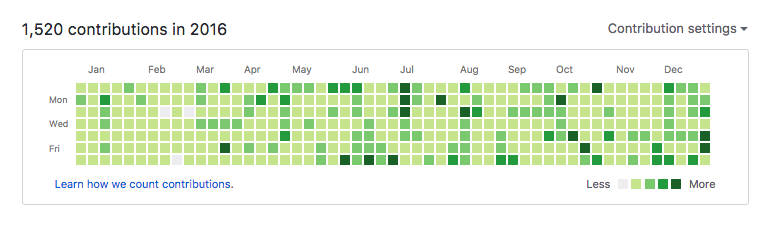
The Github Contributions Chart
Then, I wrote a simple Python module (github_contributions) to help scraping a user’s contribution history.3
Combining these two components, I had something that worked “on my machine” for generating contribution models. I was elated! It took me about a week to get this prototype up and running, but when I saw the first model using real contribution data, I knew I was on to something pretty neat.
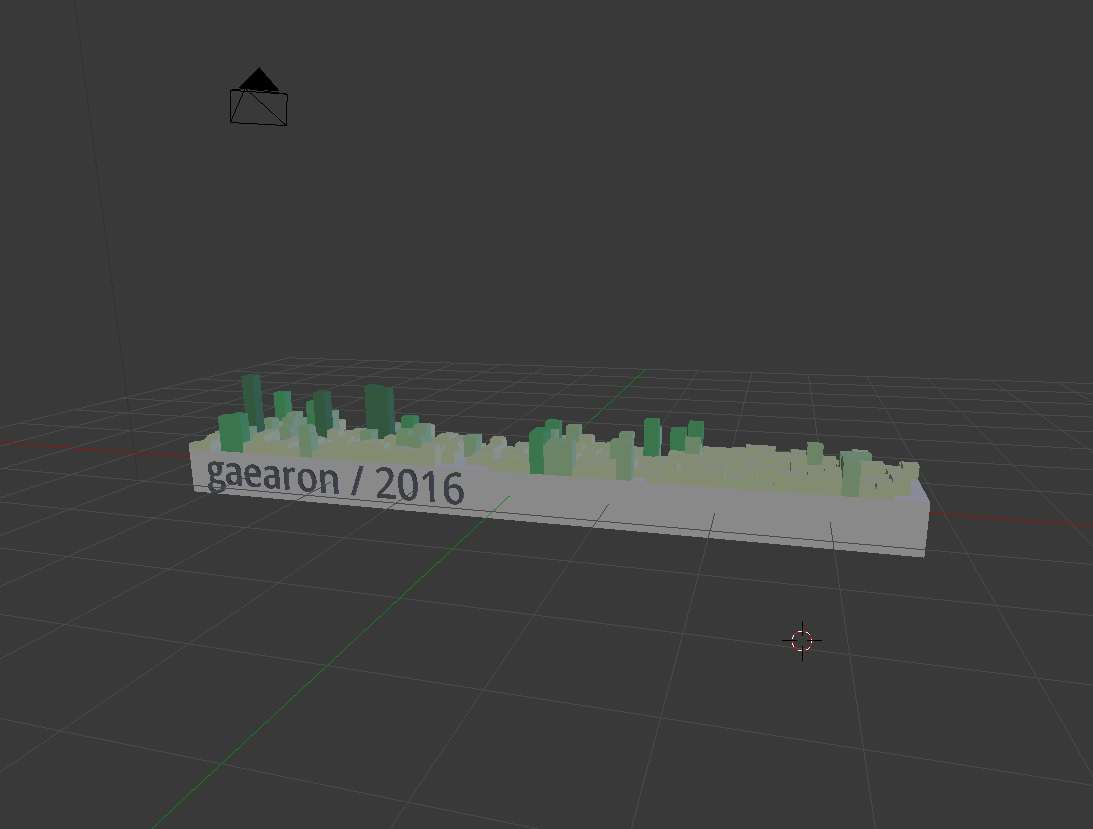
Example Blender Preview of Initial Models
Backend
The other design constraint I imposed on myself is that rendering needed to be done quickly and cheaply. AWS Lambda was my platform of choice – as it is for many of my projects. Using a serverless platform allows projects persist online for longer, because their hosting costs are usage based – you only pay when someone uses it, instead of having fixed server costs.
However, it is a bit of a pain to get anything that requires binaries or libraries to run in Lambda. I spent about a week getting Blender to compile statically into a binary that could be shipped off to lambda. This was not fun. The fruit of this work was bpy_lambda, which should allow anyone to use Blender inside Lambda with minimal effort.
I put together a Lambda function that scraped Github contributions, and spat out a X3D model. It worked! The only problem was that it too >8 seconds per model just to generate – too slow.
Another hurdle was filesize. Rendered models – even compressed – were upwards of 800Kb. Long request times and large response bodies are two things I wanted to avoid in the final version.
Current Architecture
After deciding I needed to use something other than Blender, I discovered Three.js. Three.js is a really awesome projects: it’s a really solid 3D Javascript library that sits on top of WebGL.
I decided to switch around my design to do model generation in the Frontend, and have the Backend only scrape/serve Github data.
Backend
In the final version of the site, I kept the Lambda backend, but used it only for scraping Github contribution data. The Lambda functions are managed by Zappa. I’ve used Zappa in a bunch of previous projects – it’s a really awesome project, and allows you to write normal web apps (Flask, Django, etc) and deploy them in a serverless context.
Scraping Repo Contribution Data
One challenge with the backend was scraping contribution data for Github repositories. Users are easy – you can just grab the day-aggregated statistics from their profile page. Repos are harder. The Github API doesn’t expose these stats in a meaningful way.
After mulling over this problem for a while, and consulting with Aaron Francis (who created CommmitPrint), I decided to get repo statistics by using git to clone the repo, and then processing the git log.
This introduced another headache of getting a binary to compile for lambda – this time, with git. Again, I packaged this up in a Python module for others to use: git_lambda.
To call git within the backend API request, I used kennethreitz’s delegator. It provides a nice, clean interface to the subprocess module. For instance, here is how I get the logs from git:
log_cmd = delegator.run(
    ' '.join(['git', 'log', '--pretty=format:"%ad"', '--date=short'])
)
log_lines = log_cmd.out.split('\n')
Unfortunately, cloning git repos – especially large or popular ones – can be quite slow. I was able to improve performance slightly by doing a bare clone, and using the shallow-since argument of git clone to reduce the amount of deltas git needed to pull down.4
S3 Repo Data Cache
The git clone optimizations brought down the time-to-scrape significantly, but there was still room for improvement. To further reduce API request times, I cache the results of each repo I scraped in S3. GitTrophy data is collected in 1-year windows, so I cache indefinitely the repo data from previous years, and have a 1 day cache retention period on repo data from the current year.
Assuming that larger repos likely tend to be more popular (and vice-versa), I expect the hit rate for this cached data to be rather high.
I also pre-fetched the top 1000 most popular repositories in S3, just to cover-the-bases of really popular repos.
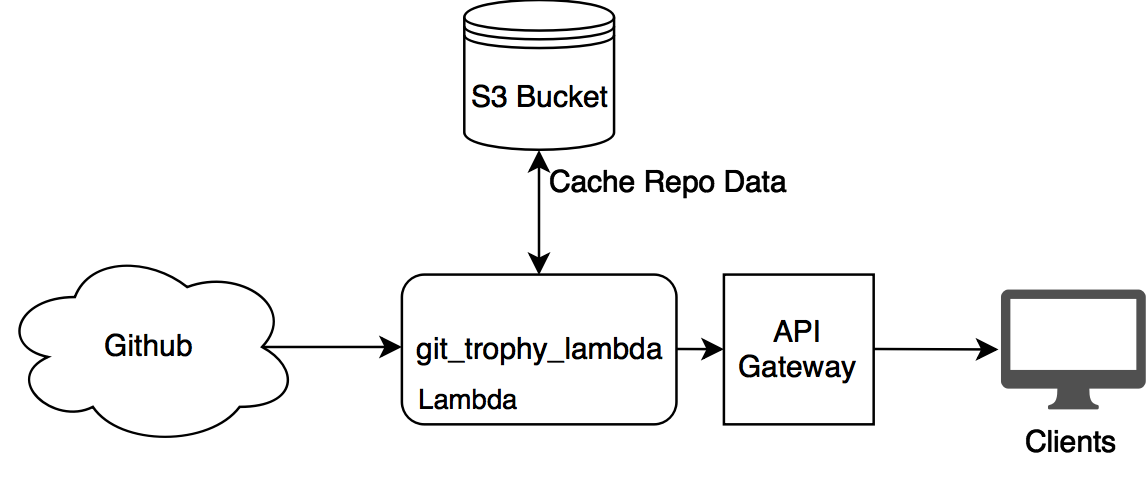
GitTrophy AWS Setup
Frontend
The GitTrophy frontend uses React + Redux for the site logic, and react-three-renderer as the Three.js <-> React interface.
Model Generation
Using react-three-renderer, it was pretty simple to generate the models. All the 3D elements use normal React semantics – each cube and material is just a React component.
I did have to mess around with Three.js’s rendering settings to get something that looked decent. Enabling anti-aliasing, raising material roughness, and setting material shading to flat went a long way to making the models look better in the preview window.
Each day bar in the chart is rendered like this:
<mesh key={idx} position={pos}>
  <boxGeometry
    width={1 / 7}
    height={height}
    depth={1 / 7}
  />
  <meshStandardMaterial
    color={new THREE.Color(BAR_COLORS[day.level])}
    roughness={ROUGHNESS}
    shading={THREE.FlatShading}
  />
</mesh>
I really like react-three-renderer; it encourages functional, declarative design-patterns that work really well with React.
The rest of the model-generation logic is pretty simple: It’s just a matter of transforming and positioning cubes, and adding a label to the model using Three.js’ TextGeometry.
Model Exports
Exporting the models was the biggest hurdle of switching from Blender to Three.js. Blender has native X3D support, which made it trivial to export models. Three.js does not. Fortunately, I’d earlier done some work on a Three.js X3D loader, so I was somewhat familiar with the format.
I ended up writing a simple X3D exporter for Three.js. I don’t think it’s quite general enough to be split out into a separate package (although, it’s something I’m considering), but it does the job! X3D is a surprisingly simple XML-based format, so writing an exporter wasn’t that difficult. (The main challenge was actually finding the spec for X3D, because all the online documentation is rather terse)
I finally used a recursive tree-traversal in real life while writing the exporter, so… that was fun. 😛
UI
Other than that, the site is just a normal React app. I used react-semantic-ui for the UI components – it’s my current favorite React UI component library. SemanticUI looks clean, has a wide range of components, and scales nicely – making it easy to produce a mobile-ready version of GitTrophy.
Conclusion
In the end, I’m really happy with how the site turned out. It feels responsive, and pulls data down relatively quickly. I also wrangled with Three.js enough to have the models look decent in the preview, and am happy with how the preview “look and feel”.
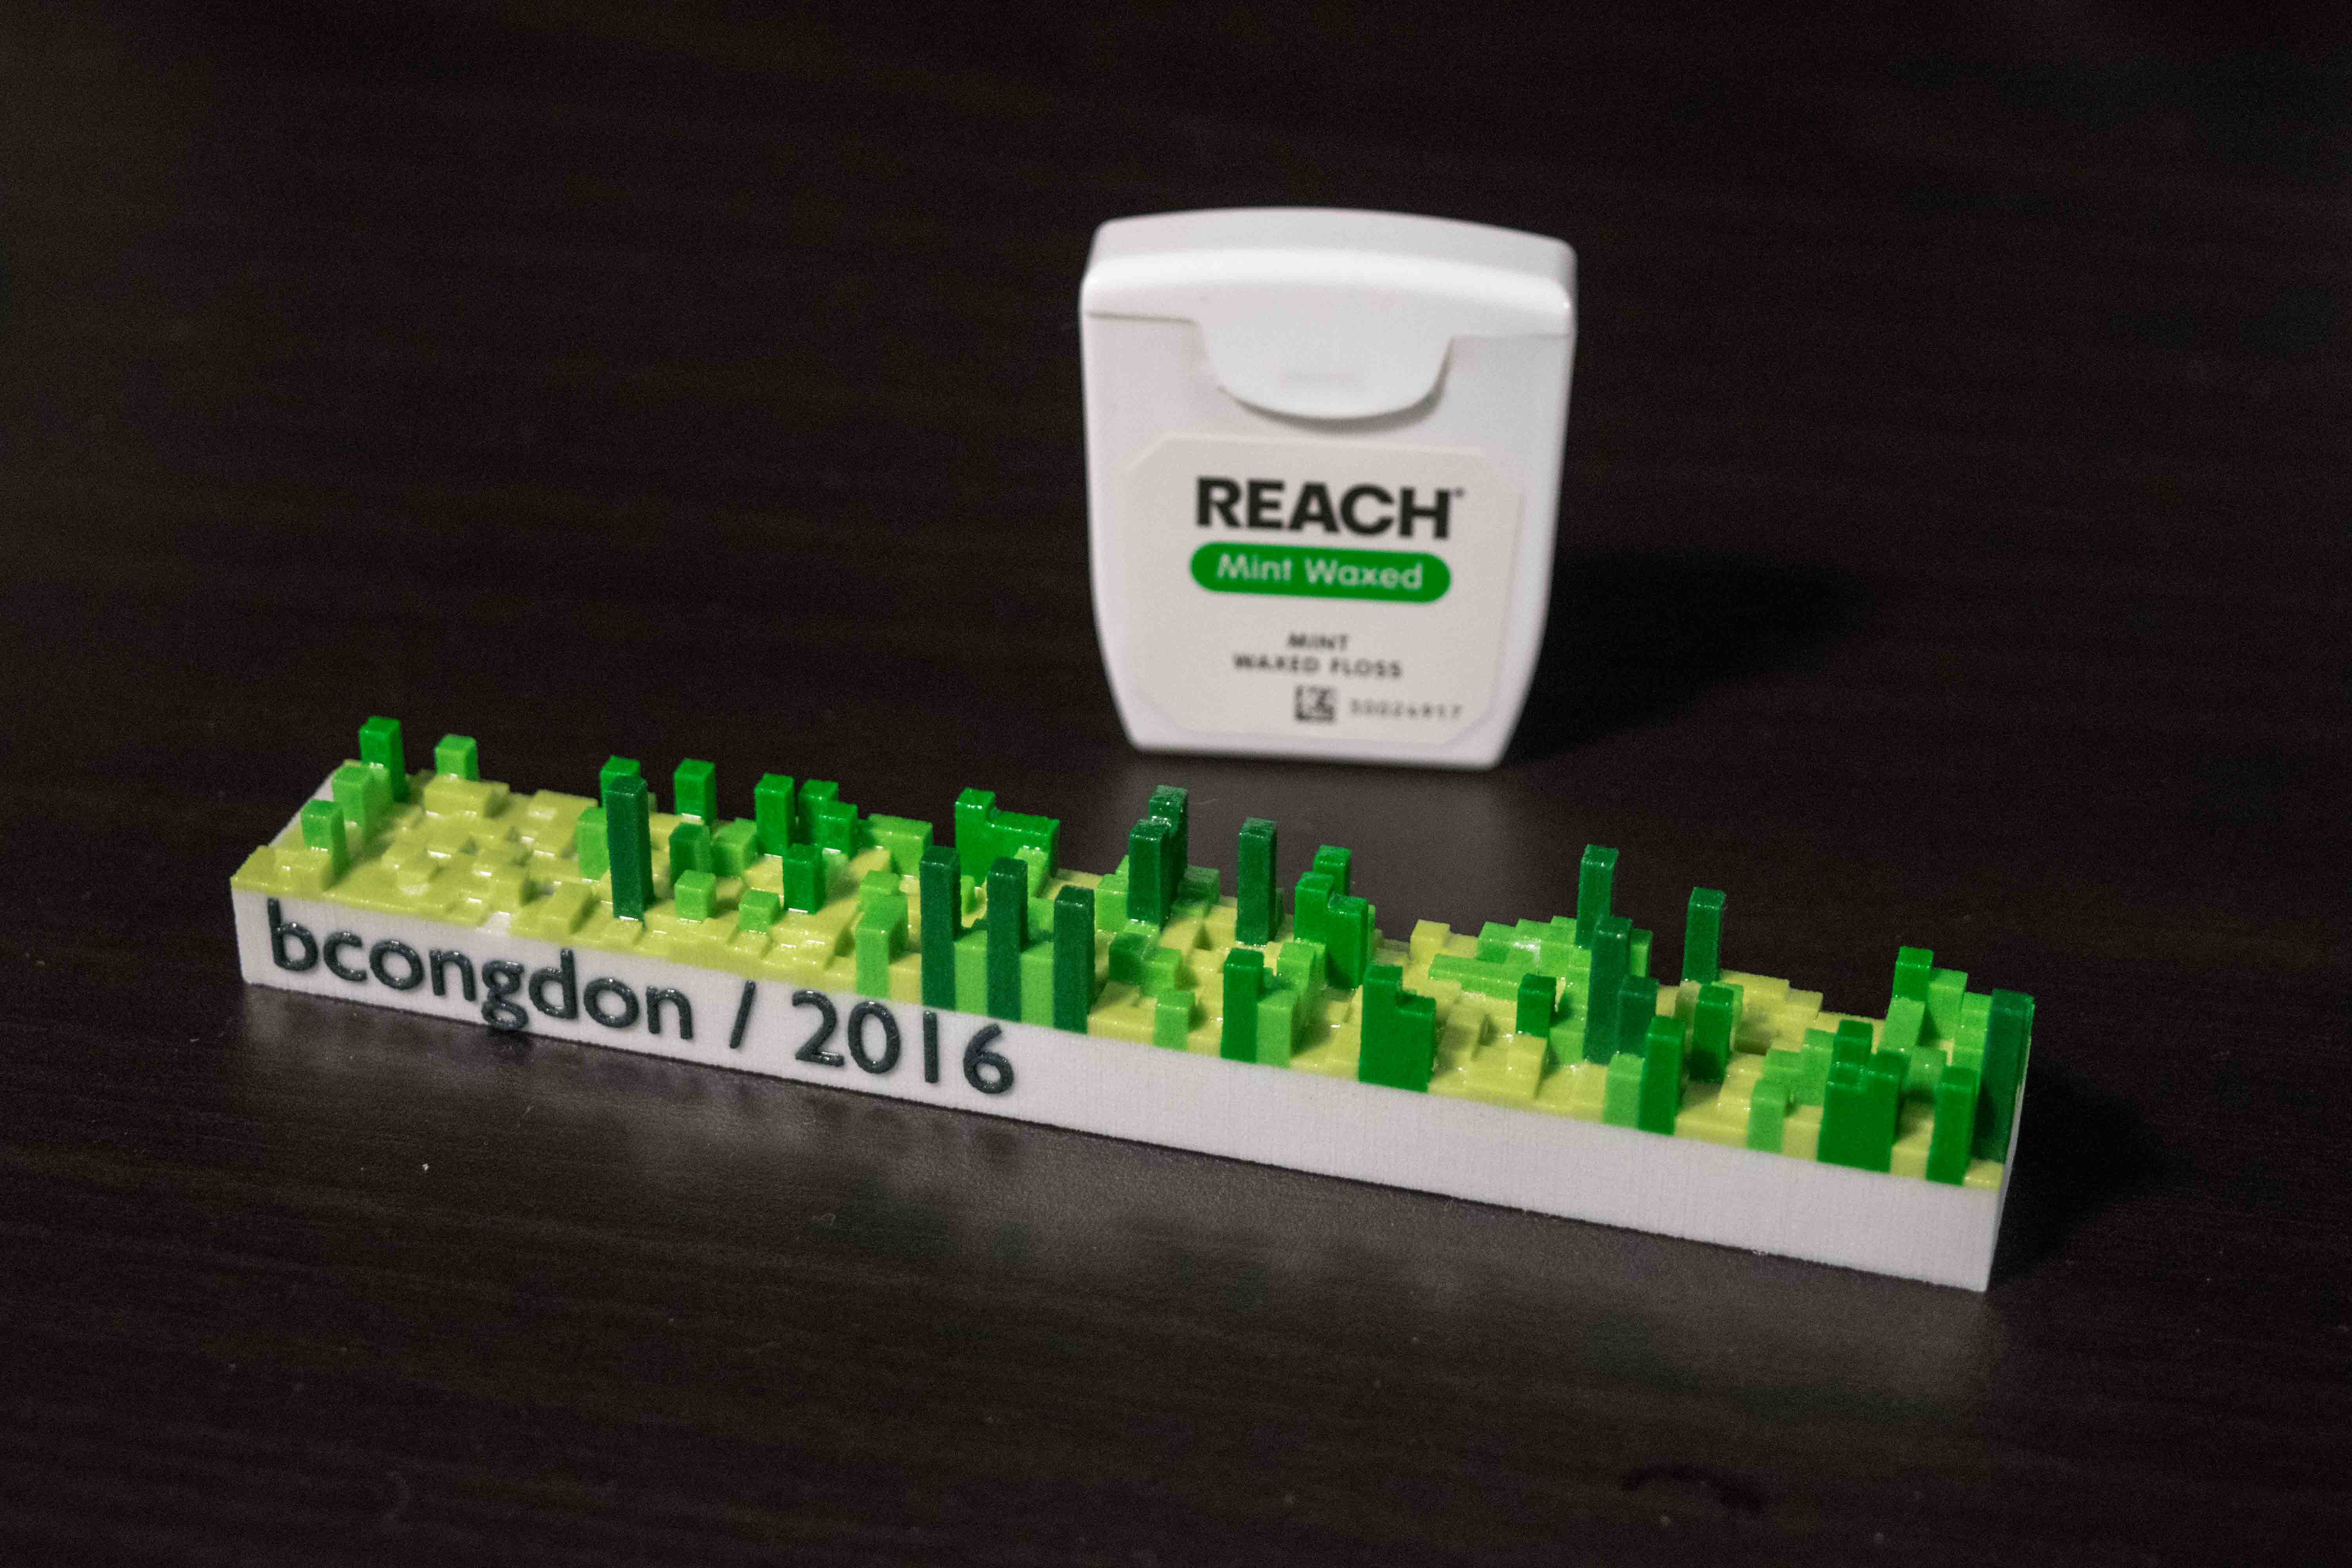
I’m also quite happy with how the models turned out. I got my 2016 Github contributions printed by Shapeways; it’s a really cool desk ornament. I’ve had very minimal experience with 3D printing in the past, so I was glad that the print went as well as it did.
Printed 3d Model of My 2016 Github Contributions Box of Floss for Scale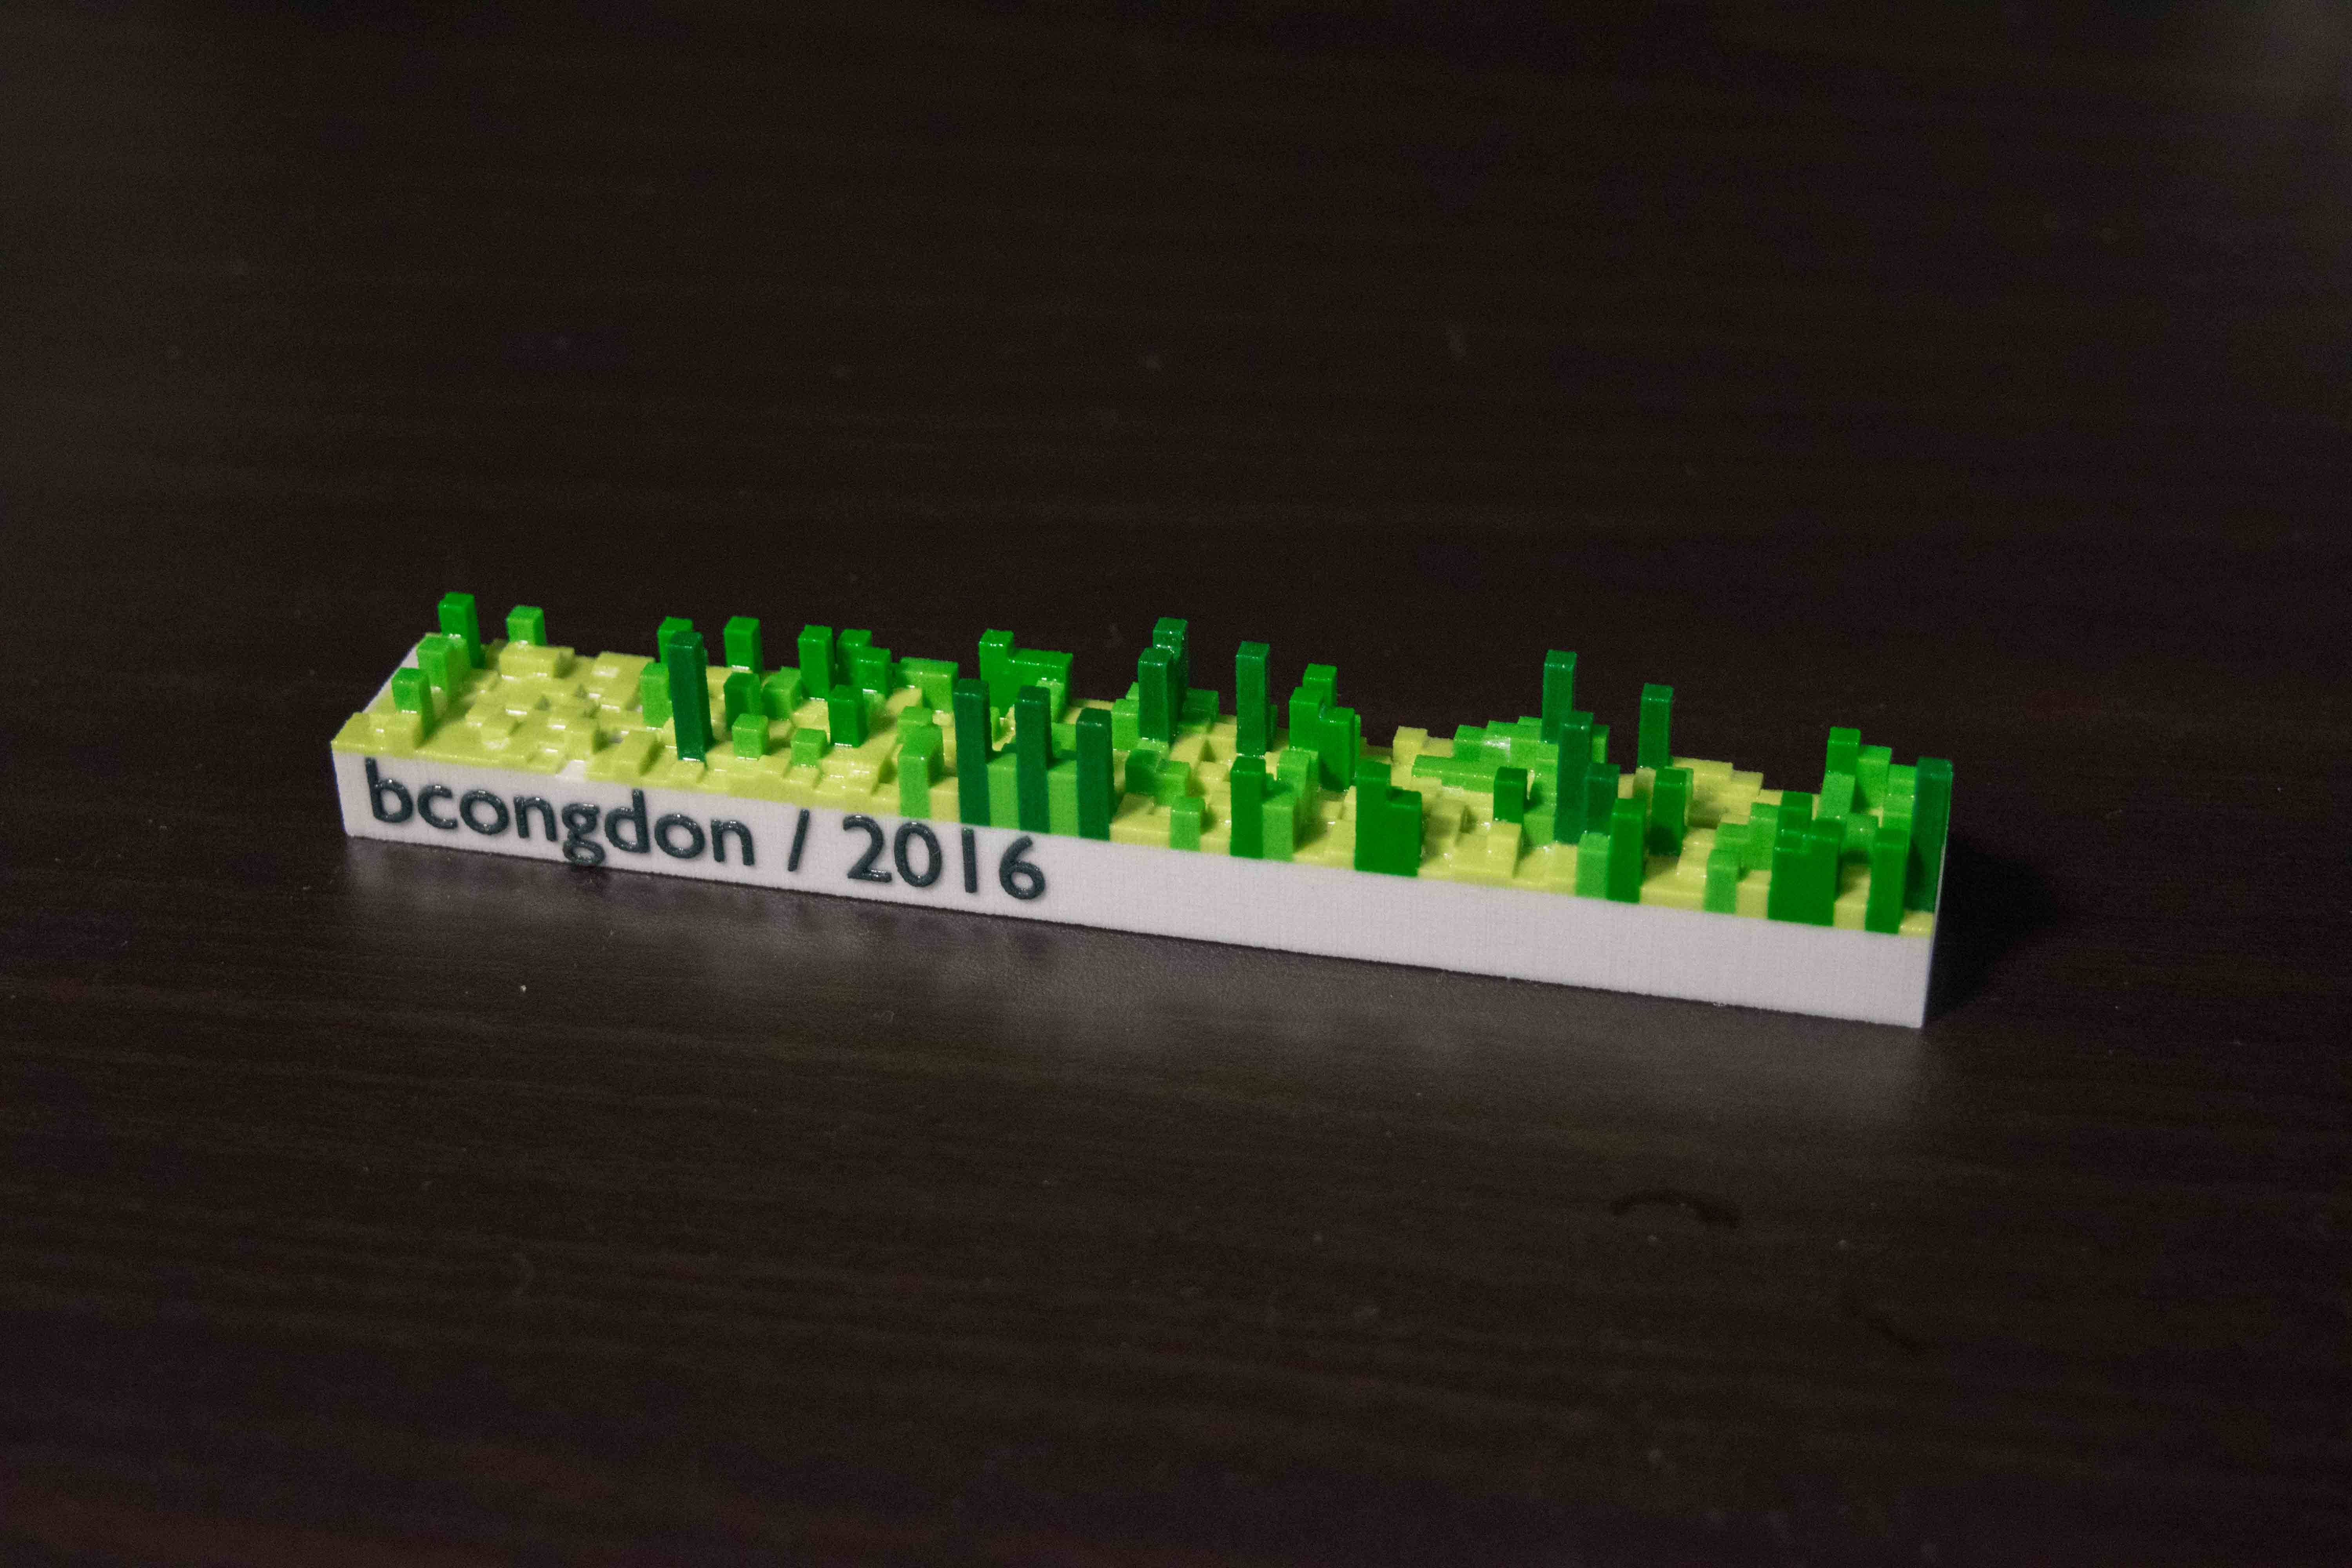
Any questions? I’m on Twitter as @BenRCongdon. Also, the GitTrophy repo is public, so feel free to check it out and leave a ⭐ if you’re so inclined. 😉
-
Looks like this project is now dead. ↩︎
-
I’m aware that there’s been some controversy in the past months about contribution graphs being harmful to contributors. I agree that there’s merit to these arguments. But, for the time being, I still enjoy the “gamification” of making contributions. ↩︎
-
Unfortunately, Github doesn’t provide a public API that provides this data, so I used BeautifulSoup to scrape the SVG data of the actual contributions chart. ↩︎
-
I’m a bit disappointed that
git clonedoesn’t have a--shallow-untilargument, but I can see that it would have limited usefulness outside of projects like this. ↩︎