GDQStat.us, for those who didn’t see it during this year’s SGDQ, is/was a realtime data visualization of that biannual charity livestream. I had wanted to do something with realtime dataviz for the better part of a year - case in point my ‘failed’ Twitch visualizer, CrowdShout - and had just gotten the Javascript chops to be able to pull something like this off.
So, in early June when I first had the inking of an idea to do this project, I jumped head first into the world of realtime data aggregation and visualization, and had a really great time.
What I set out to make
Not knowing how much time I’d want to invest into this, and not having a ton of Web experience, I decided initially on a relatively small scope.
Inspired by Alligatr’s past *GDQ visualizations, I decided basically to copy them as my initial proof of concept.
My initial plan was this: I wanted all of the web content to be static - backend aggregation was a must, but I didn’t want to have to deal with active web hosting. Github pages was comfortable, and reliable. I planned on having some scripts run on one of my RaspberryPi’s, and having the data store be a SQL or Mongo server ‘somewhere’.
What I really wanted to sink my teeth into (and, consequently, what I spent the majority of the first ~week on) was the D3.js visualization. This was the fun stuff. D3.js, as I learned, is super flexible, but it has a very steep initial learning curve. I looked around for alternatives/wrappers to simplify the process, but none of them gave me the full breadth of expressiveness that bare D3 does. (As an aside, I did end up using C3.js for some of the secondary graphs, and ended up really liking it as a braindead-simple version of D3.
But I digress. Essentially, I was going to make a slightly teched up version of Alligatr’s graphs, just with a more sane datastore (he used an updating static JSON) and perhaps some realtime elements.
What I ended up making
The Database
I decided early on to use Firebase as my realtime database. It had support for update webhooks, which made it easy to send data updates to the client every minute. It also meant that I didn’t have to deal with the database hosting myself.
However, towards the end of my development I ended up hitting huge performance issues with Firebase. Load times for the ~1Mb amount of JSON I was requesting were ludicrous - on the order of 10 seconds. It didn’t help that my visualization needed all of every piece of data I ever recorded to render correctly, but after an afternoon of troubleshooting, it appeared what I was doing with Firebase wasn’t going to work.
So, I ended up switching to a caching model, wherein Firebase was still my authoritative database, but then I wrote a NodeJS script to save everything in that database to a JSON file in Google Cloud Storage. It was the cloud ‘cached’ JSON that the client was served. Load times dramatically decreased, and I still had the flexibility of using webhooks to send updates via Firebase.
The Main Visualization
I spent a crazy amount of time on the main graph displayed front-and-center on the home page. Initially, it took a lot of time just to get it working - as I said, D3 has a large learning curve. Once I got a handle on it, I was able to add some cool features, like the ability to switch data sets on the fly.
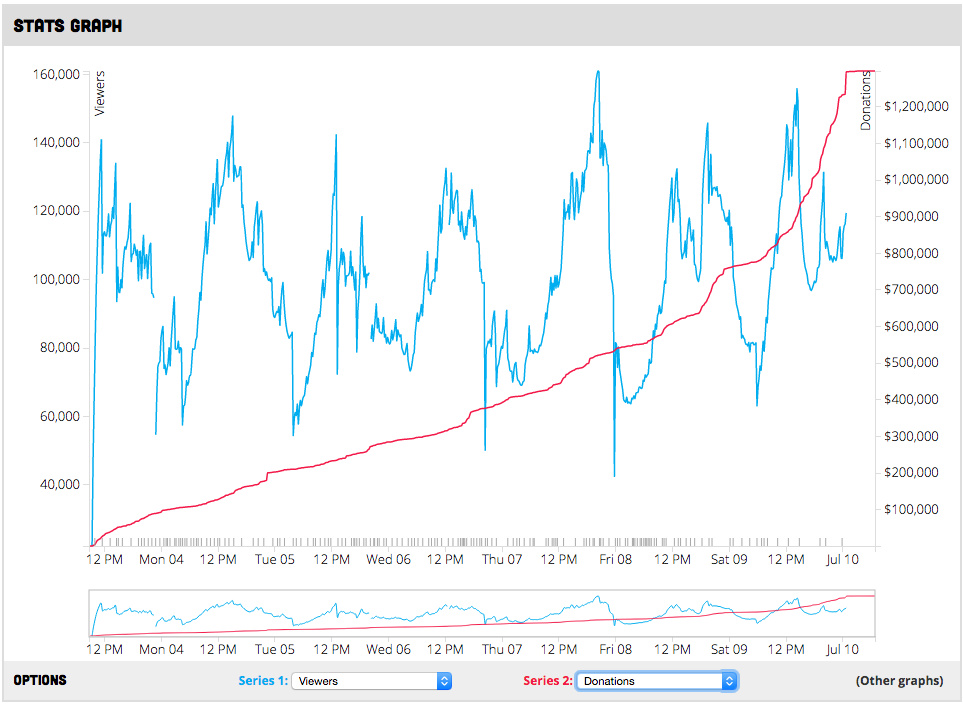
The Main Graph
I also added realtime data updates, so that the graph would continuously rerender as new data came in via the webhooks.
However, out of everything I made, the JS that runs the main visualization is probably the messiest of all of it. Lots of No-No’s scattered throughout, like poor use of globally scoped variables.
The Front End
I ended up getting some other cool bits and bobs into the site as well. In particular, I really like the dynamic odometer elements that show you current / aggregated statistics. I used odometer.js for this, and personally I think the animations are awesome.
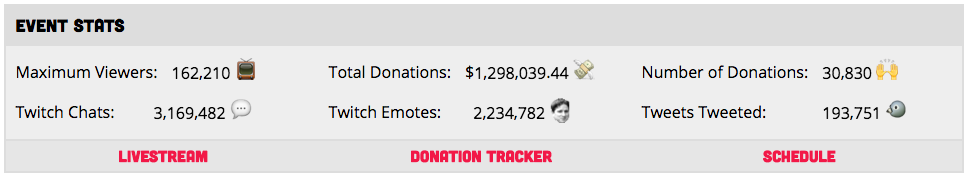
Mmmm… Odometers…
I’m not particularly happy with the games schedule table - especially with how it links to the main graph. It has some weird behavior. But it works, mostly.
Collection Scripts
As I was already writing a bunch of Javascript for the backend, I decided to use NodeJS for most of the backend data collection scripts. There wasn’t much that ended up being remarkable with the collection script suite, other than it’s large scope.
I ended up reinventing cron by using foreverjs and node-schedule in concert. Now I’m kicking myself a bit because of this, but at the very least it aggregated the logs nicely, and mitigated the risk of a script failing and not restarting.
Deployment / Automation
This project probably had the most complicated deploy process of any of my personal side projects so far. I essentially had two pieces: the server side script package, and the web content.
The server scripts were a painpoint. I didn’t have a great way of doing an integration environment, so every time I wanted to push an update, I had to pull the repo, stop all of the collection scripts, and hope that my changes weren’t breaking. More than a few times I potentially missed some data due to an uninstalled dependency or whatever causing the scripts to not come back online immediately.
However, the web content turned out to be a bit easier. Because I was deploying to Github pages, I only needed to merge changes into the gh-pages branch. I added a bit of optimization / automation by using some rake tasks to minify all my HTML/JS, build the site, and deploy that to the release branch. It might have made more sense to have a separate release repo the way I ended up solving this problem, but I was against that - on principal.
Summary
In summary, the feature creep on the project was, in a word, massive. By the end, I had a fully automated suite of web scrapers which pulled in data minutely from no less than 4 sources (Twitch Chat, Twitch API, Twitter, and SGDQ’s donation tracker).
I eventually found it necessary to add basic health check notifications, so as to be notified when one of the trackers went down. So, I built a basic script that would ping my phone via Twilio whenever a data source stopped producing data.
Yeah, I super over-engineered it. There’s really no way to argue against that, but it kept my free time occupied for the better part of two months, and so I’d call that a success. (Consequently, I also learned an insane amount throughout this whole process.)
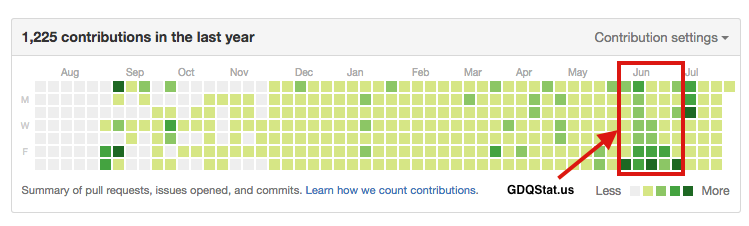
I did a fair number of commits on this project…
How it performed during SGDQ2016
Look for yourself! All the visualizations are still up.
Seriously though, everything went off without a hitch. There were no data ‘outages’ that were the fault of me or my scripts - Twitch’s API has some hiccups when large numbers of people enter or leave a stream, which did cause some holes in the numbers.
There were a couple of alarms that went off, but to my knowledge I don’t think there were any failures that caused holes in the data larger than 5 minutes.
Over the time span of a week, and given the amount of data that was collected, I’d say that’s pretty successful.
I pushed out several updates throughout the week, and again all the deploys went smoothly.
Now, I wasn’t dealing with a ton of traffic (according to my Google Analytics), but with the way I had everything set up, all of it would be bashing against Google and Github’s hosting, so I’d imagine that I could scale for event traffic pretty nicely.
I ended up being really happy with the way that the visualizations turned out. It really was a full realization of ~95% of the pie-in-the-sky crazy ideas that I had started out with 6 weeks prior.
What I will do better next time
- Refactor. I wrote most of this code in a ‘hackathon’ type mindset. There wasn’t a good source of ‘center’ in any of this code, most of it is tacked on here and there where I felt necessary.
- Redesign. I’m not very good at web design, and what I ended up with was actually quite pretty given my past experience. However, a CSS refactoring is in order, and a redesign of the site would probably make it look quite a bit cleaner.
- ‘Advertise’ better. I did a post on reddit, but I didn’t end up having a ton of traffic. This is OK - it’s a niche site, and I don’t really care about those numbers, but with the amount of interest expressed when I did some follow up visualizations after the event, I probably could have gotten the word out a bit better.
Final Thoughts
The reason I do projects like this is twofold: learning, and creation. I learned a lot about web design, data aggregation, and the logistics of data storage throughout the course of this project and solved more than a few ‘hard problems’. I also ended up with ‘a thing’ at the end that I can point to as something cool. If ever you needed proof of the value of side projects, well… here you go.
I really enjoyed building and running GDQStat.us for SGDQ 2016. While not a 100% certainty, I’ll probably run something similar to this for AGDQ 2016 - though it depends on my school workload.
Where you can find this code
If you were at all intruiged by anything in this post-mortem, I strongly encourage you to look through the code that made GDQStat.us run.
Here are links to the relevant repos:
- sgdq-stats - The web content itself
- sgdq-collector - Data collection scripts